 Suroît
Understanding the weather
Know why the route goes that way, what the models are saying and what it costs if they are wrong.
Understand the route, not just follow it
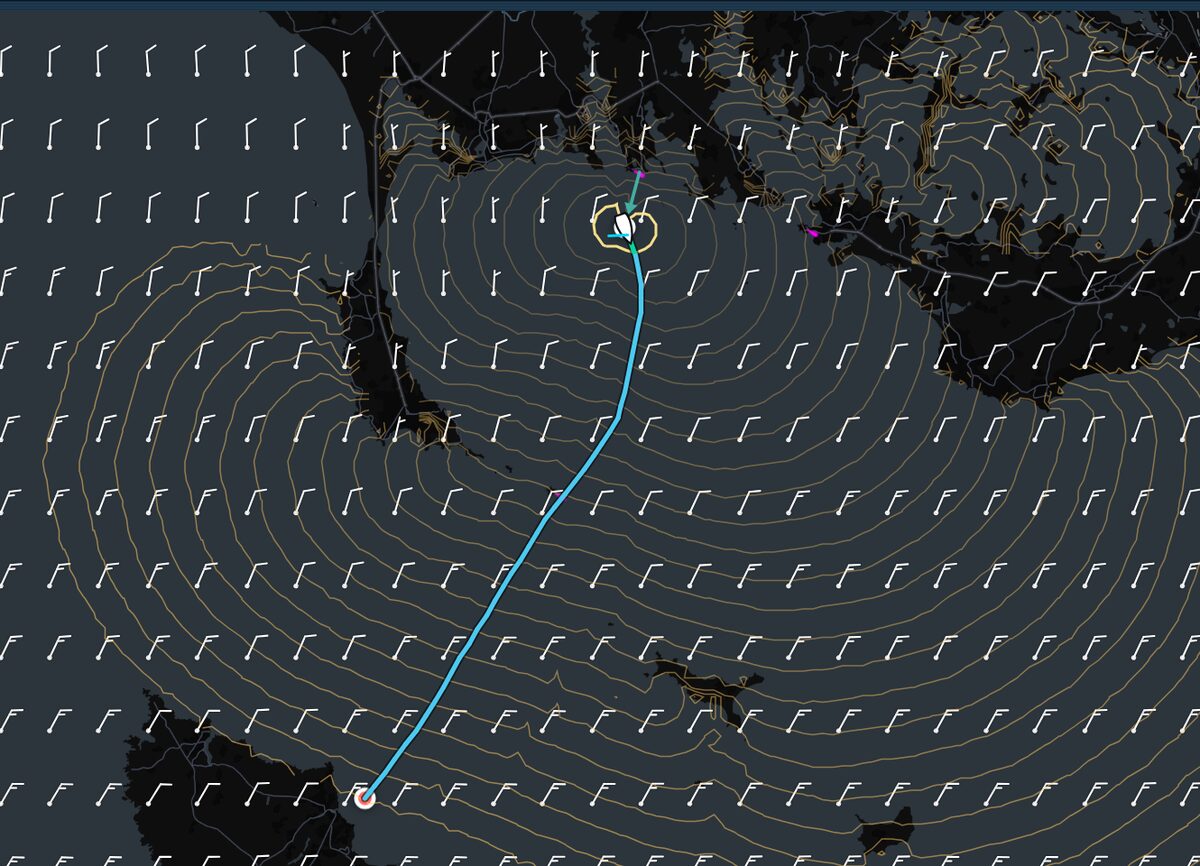
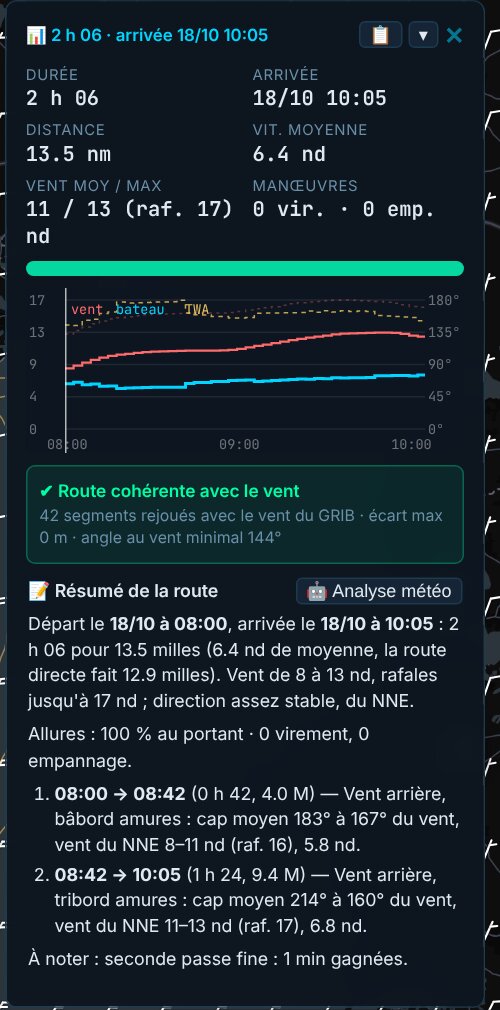
Every calculation ends with a readable summary: the phases of point of sail and tack, the wind met, the manoeuvres and the moments where it all gets decided. One more click and the weather analysis comments on the route on the GRIB charts.
Then each leg is replayed with the GRIB wind, to check that the boat holds the announced speed without ever pointing higher than its polar allows. In our tests, the gap between the route and its check stays under one metre.
Fronts on the map
Suroît detects cold, warm and stationary fronts from the GRIB 850 hPa temperature, then follows their movement from one forecast step to the next. You see when the route crosses them.
Everything in the GRIB
Temperatures from the surface to 500 hPa, clouds, rain, instability and squall risk, fog, air–sea temperature difference. Each layer is shown under the route, with its values on hover.
Wind shifts and differences between models
Wind shifts over the coming hours are coloured on the map, veering and backing. Two GRIBs can be compared point by point, in strength or direction. The meteogram brings all the models together at one spot.
The risk of a model error
Each route is replayed in weather that switches from one model to another at different times. For each scenario, Suroît puts a figure on the loss if you keep the route and if you correct it, then names the most robust route. Two models can also be blended with a weight that changes over time.